
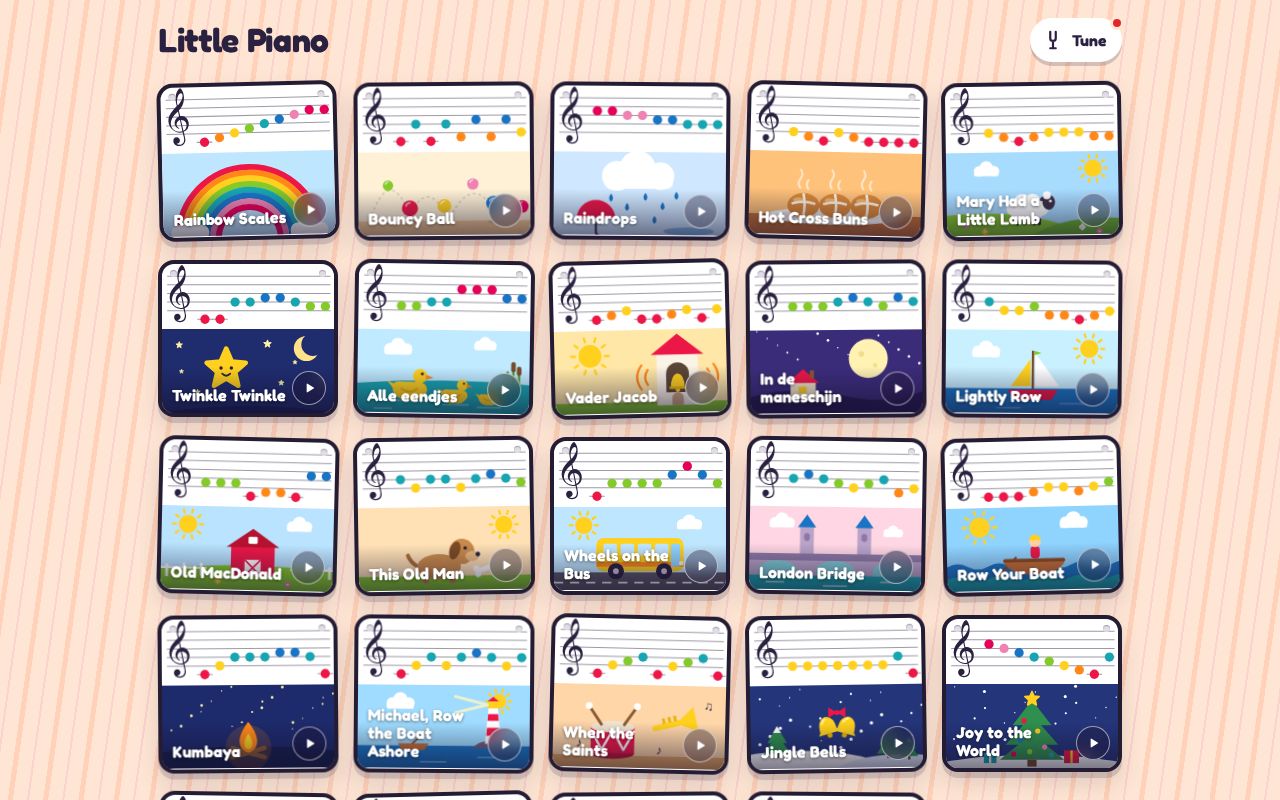
Little Piano
Play-along songbook for the Hape × Baby Einstein Magic Touch Piano
BitsExplorer finds what people are building with AI, every day. See today's picks →
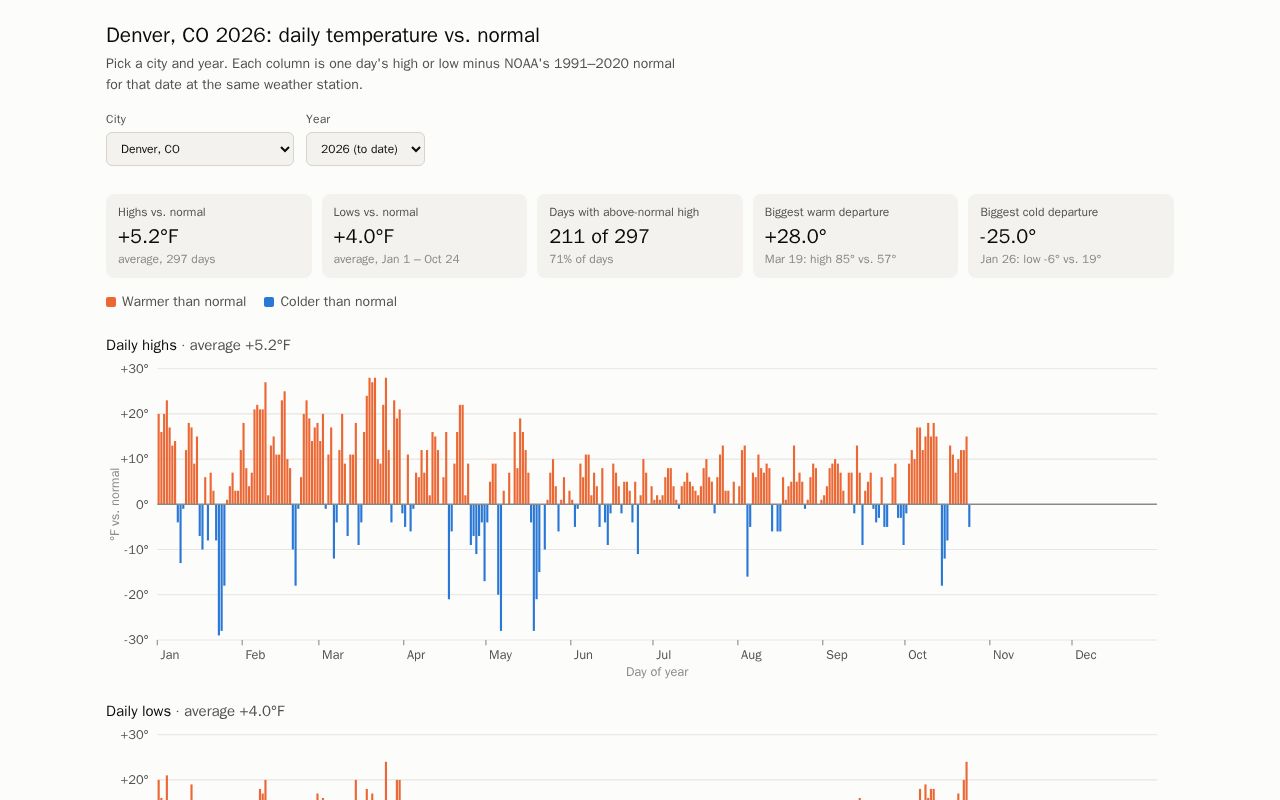
Web app that shows how daily high and low temperatures have varied from historical averages
Description excerpted from the original listing, which is linked below.
Play-along songbook for the Hape × Baby Einstein Magic Touch Piano
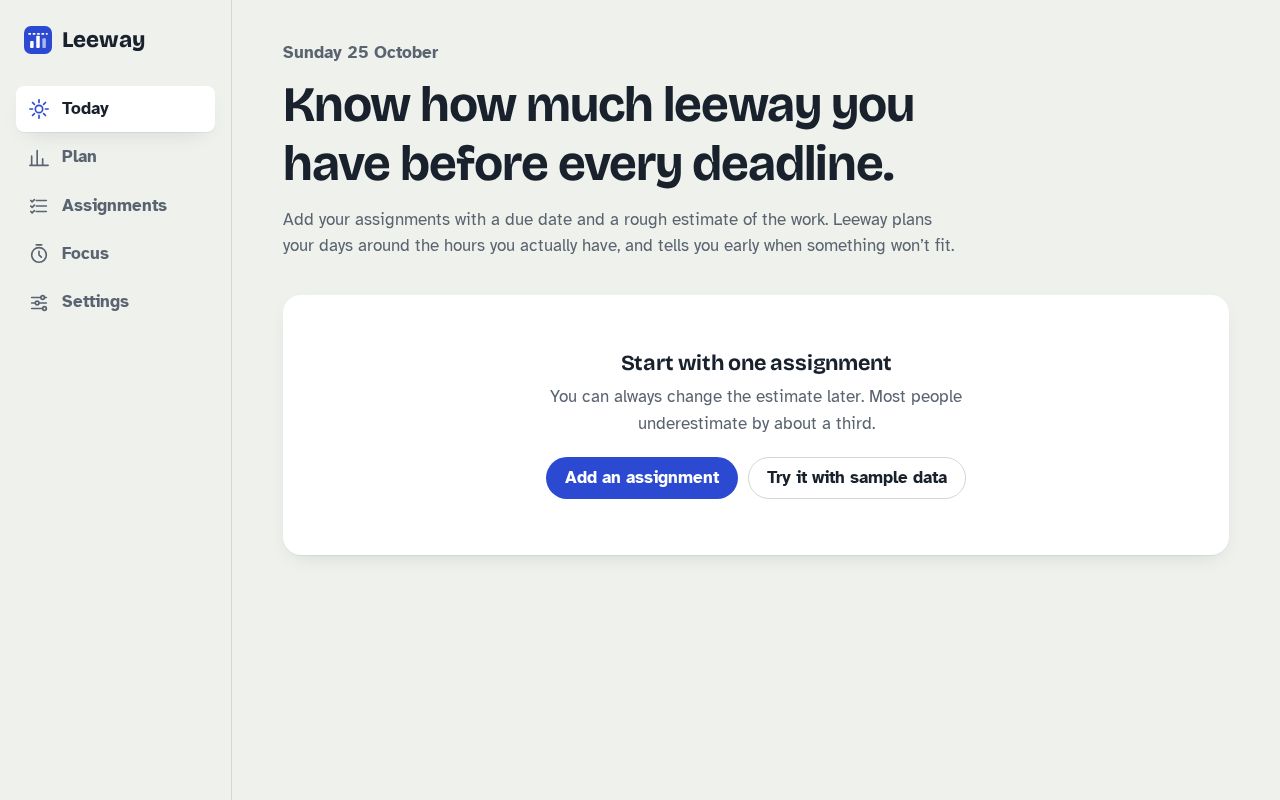
Leeway: a deadline-aware study planner that plans your days around the hours you have. Vibe-coded with Claude.
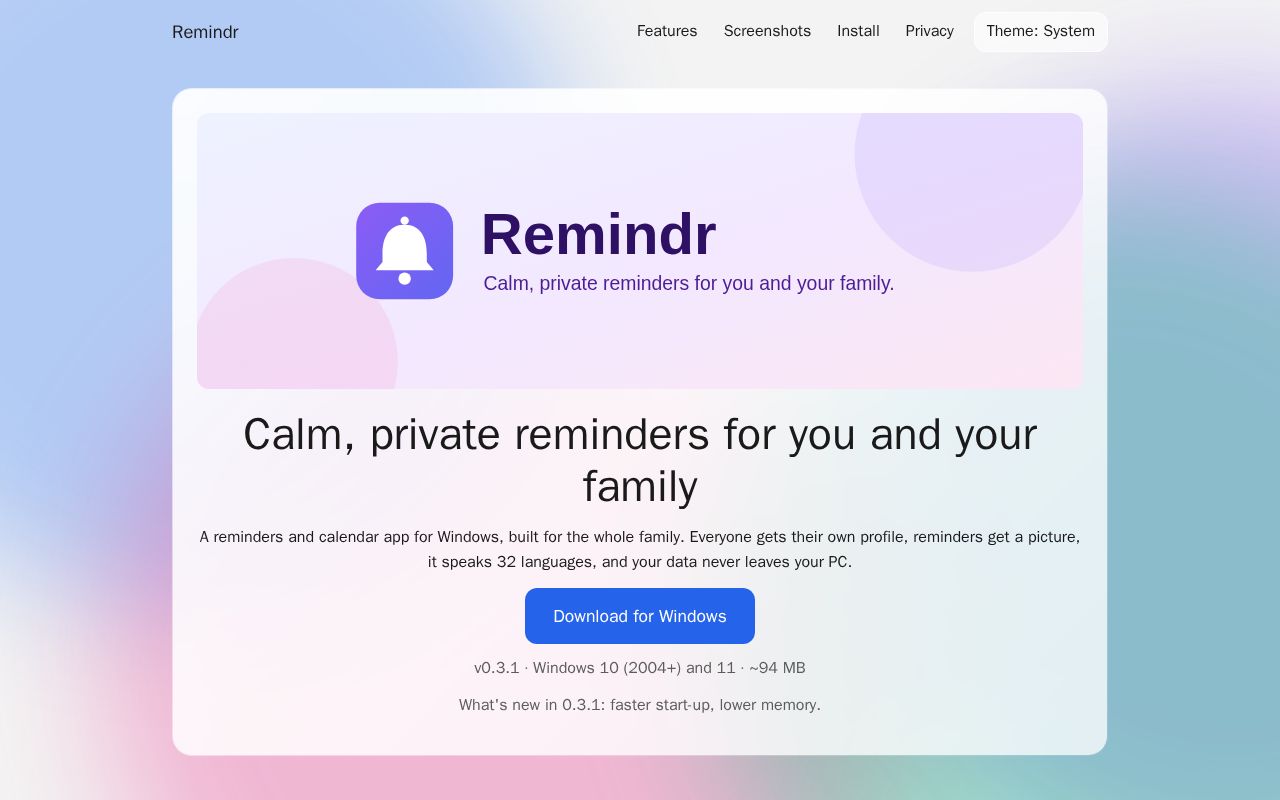
Website for Remindr, calm private reminders for Windows
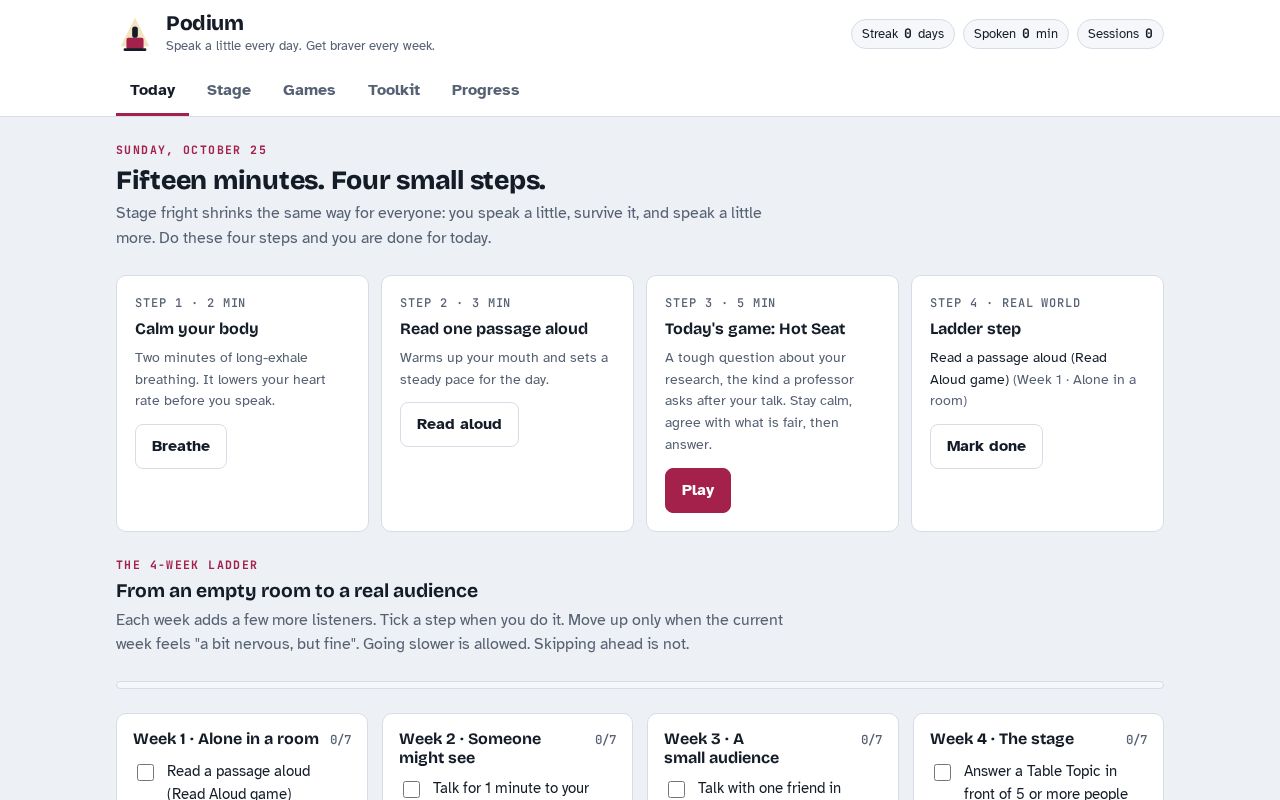
Podium: daily English speaking and stage-fright practice with live mic
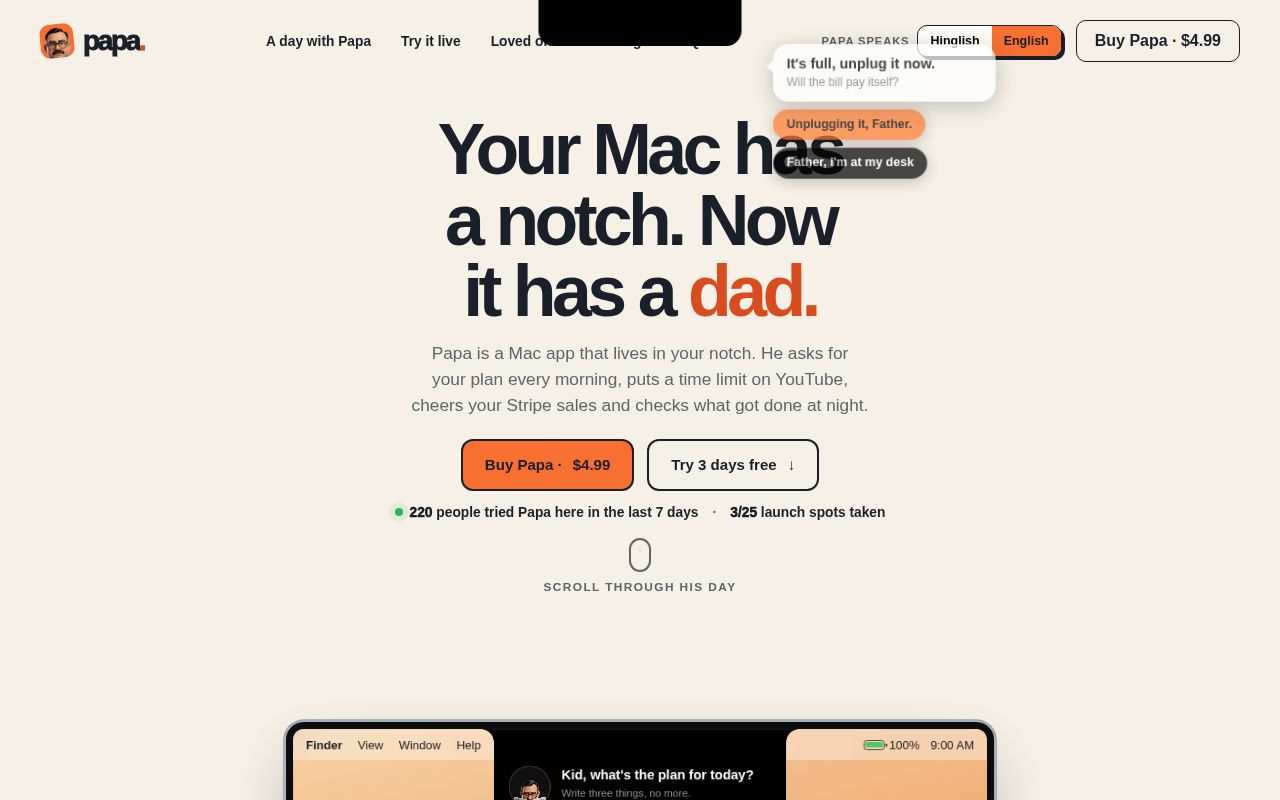
He asks for your plan, calls out YouTube, and celebrates every sale. A Mac notch app with an Indian dad's personality. 3 days free, then pay once.

Soul Eater You’re a vlogger filming a family weekend at Grandma’s farmhouse. Then the night starts to go wrong. Something in the house can’t be seen with the naked eye, only through your phone camera. Your footage is the only thing that remembers what it did. Watch it back. Look closer. Not…
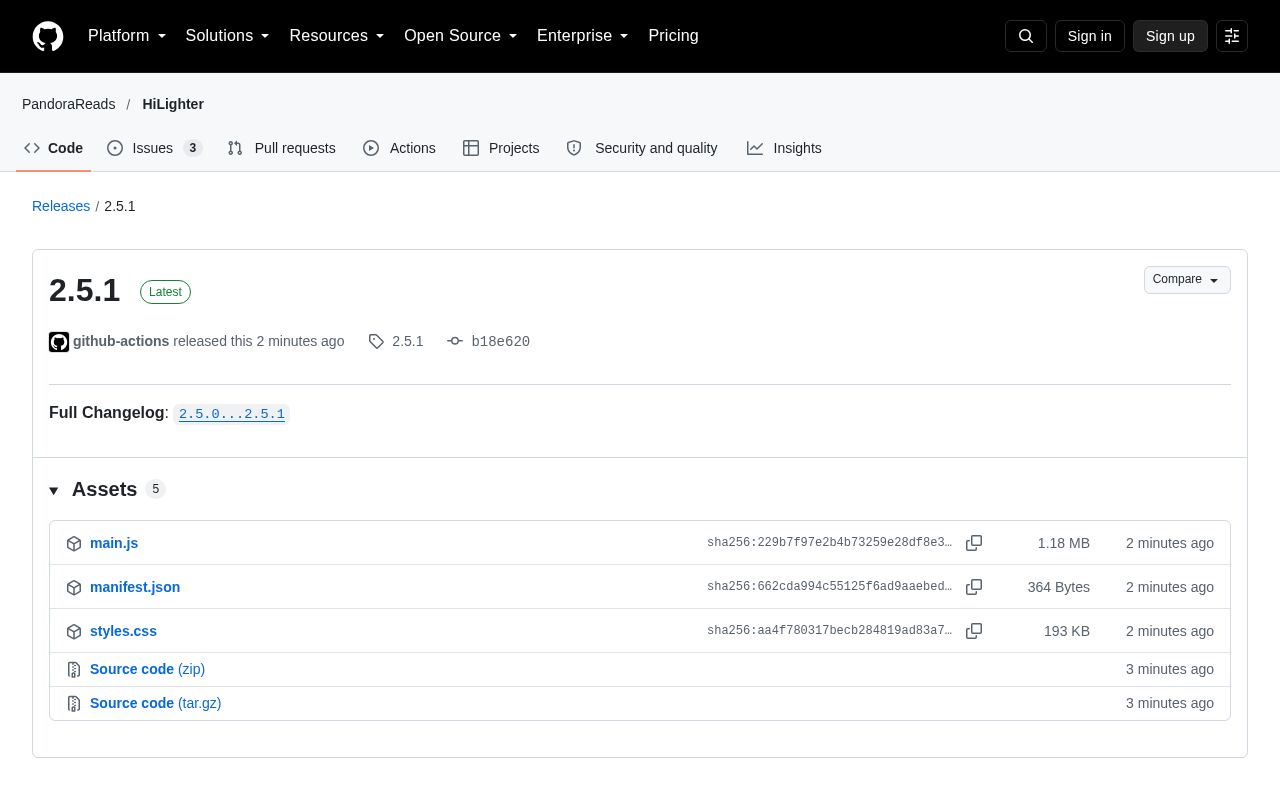
HiLighter is an Obsidian plugin focused on highlight note management. It transforms highlighted content into manageable note cards with support for multiple color annotations, AI-powered analysis, and intelligent search features, making your note organization more efficient.
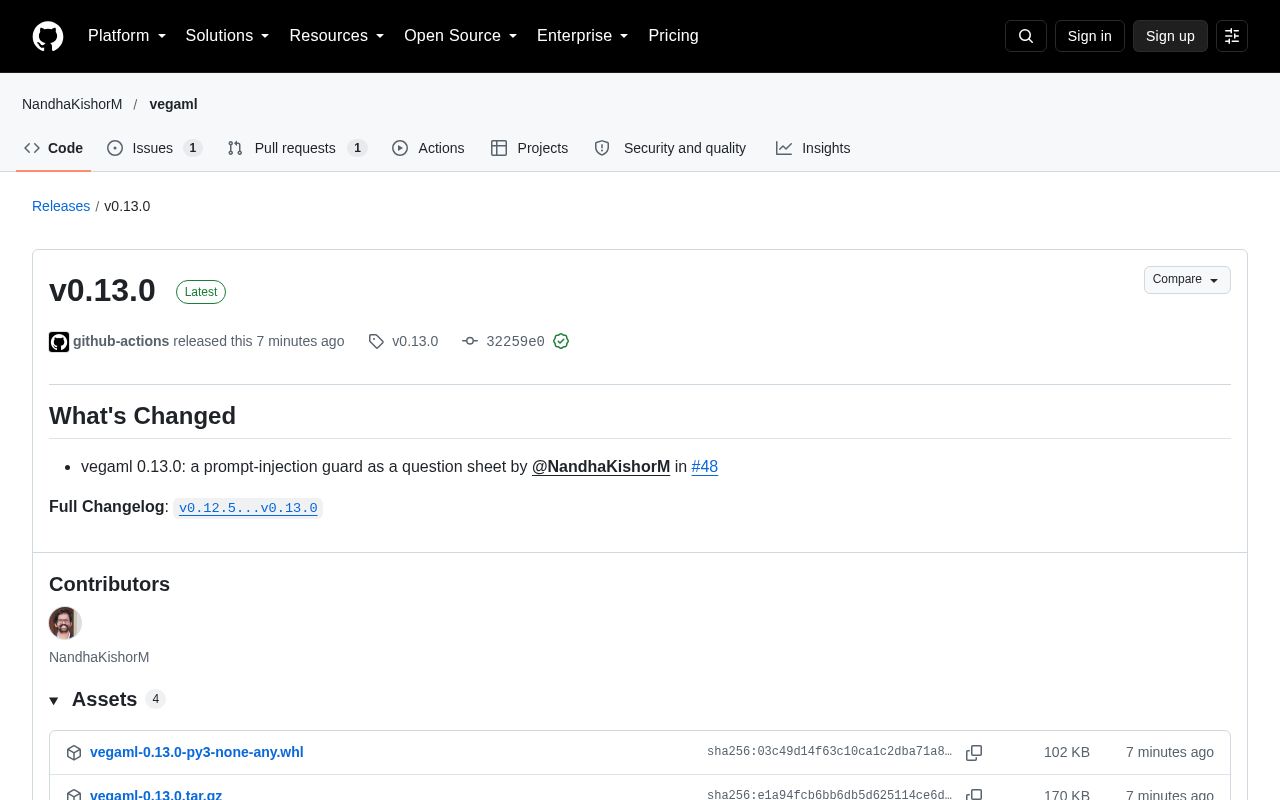
Typed decisions from a frozen language model and a small physics engine: calibrated probabilities, conformal sets, 73k context, images.
Every Monday: how many projects were built with AI that week, which tools built them, where they came from, and the week's picks.
Read the latest week