
csipolicy.com is registered at Namecheap
Center for Superintelligence Policy — csipolicy.com
BitsExplorer finds what people are building with AI, every day. See today's picks →
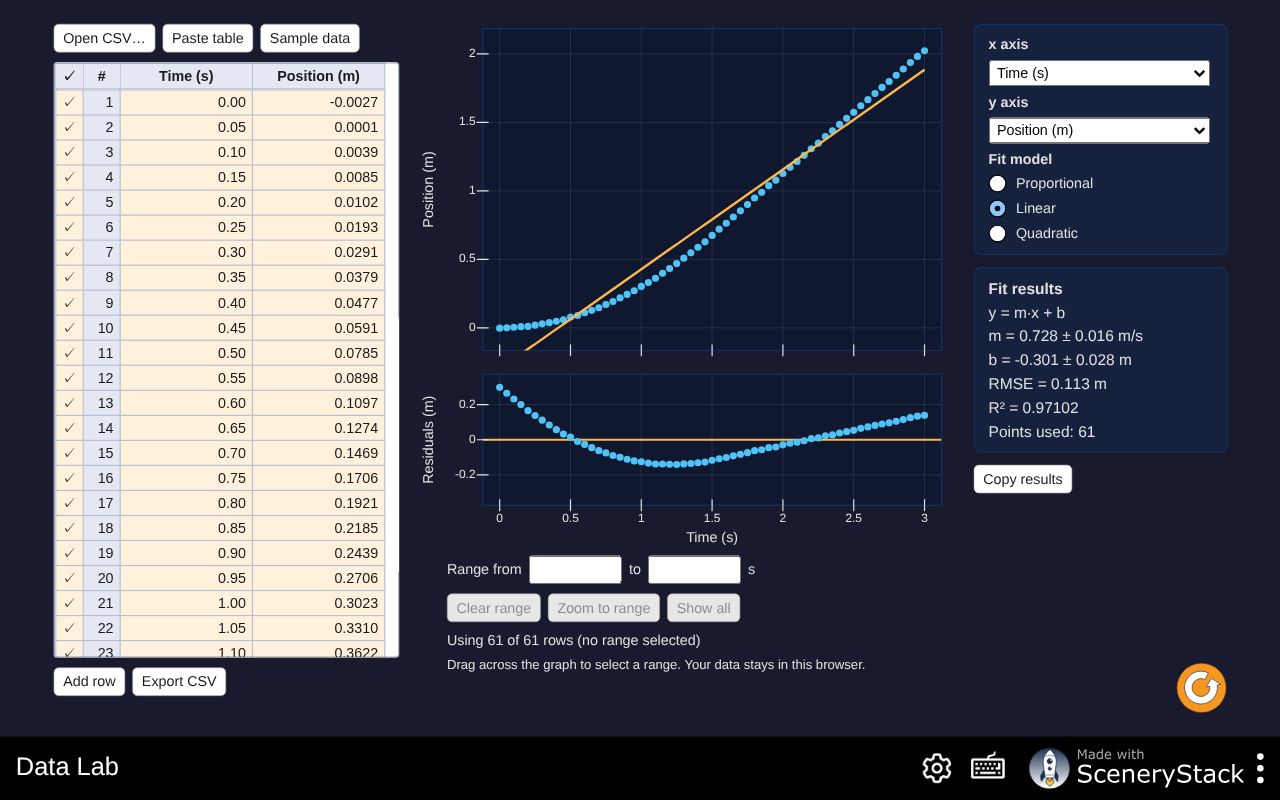
Plot and analyze your own lab data in the browser: import a CSV or paste a table, choose the x and y columns, drag across the graph to select a range, fit a proportional, linear or quadratic model, inspect the residuals, and export the results.
Description excerpted from the original listing, which is linked below.
Center for Superintelligence Policy — csipolicy.com
Free WordPress plugin: Canada Express Entry CRS calculator that saves every result as a lead in WordPress.

The agent investigates. You sign off. An incident-triage agent behind a human-in-the-loop gate, with a 24-incident eval.
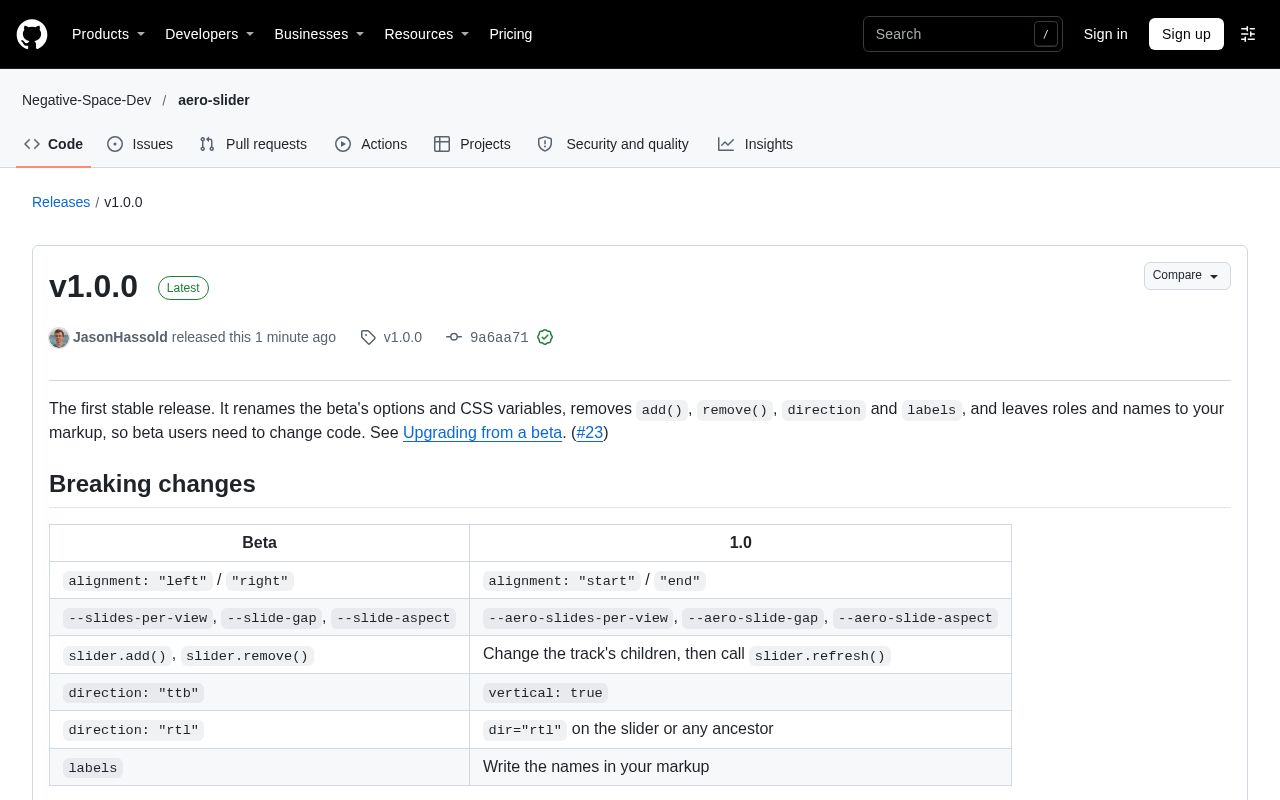
A lightweight, CSS-first slider library for the modern web
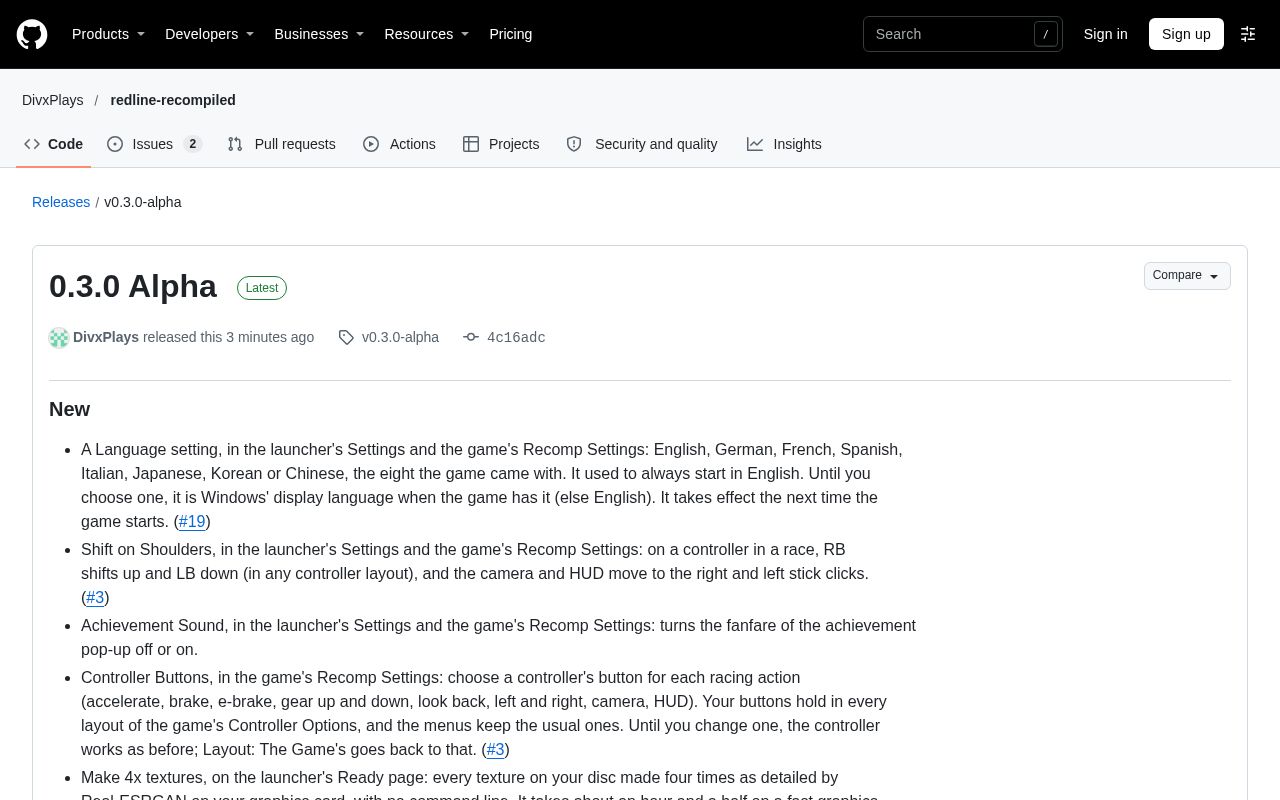
A PC port of Forza Motorsport (Xbox, 2005) by static recompilation: up to 144 fps, 4x resolution, ultrawide, DLSS and FSR. Bring your own disc. Early version: performance may be unstable; expect bugs and crashes. MADE WITH THE HELP OF AI.
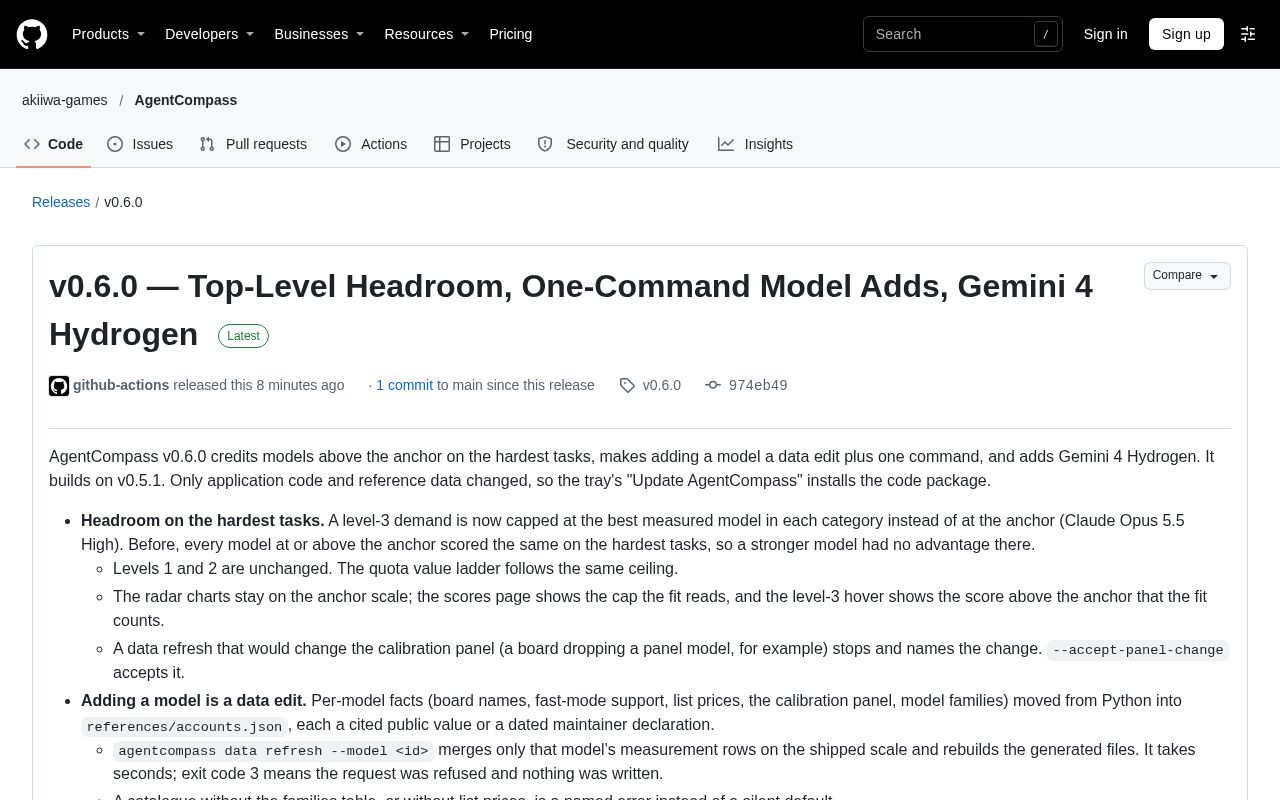
Deterministic multi-agent task router & subscription quota scheduler for Claude Code, Codex, Gemini CLI (Antigravity), Grok, and Paseo. Routes sub-agents by model DNA, ability floor, and 5h/7d rate-limit windows with a PreToolUse spawn gate.
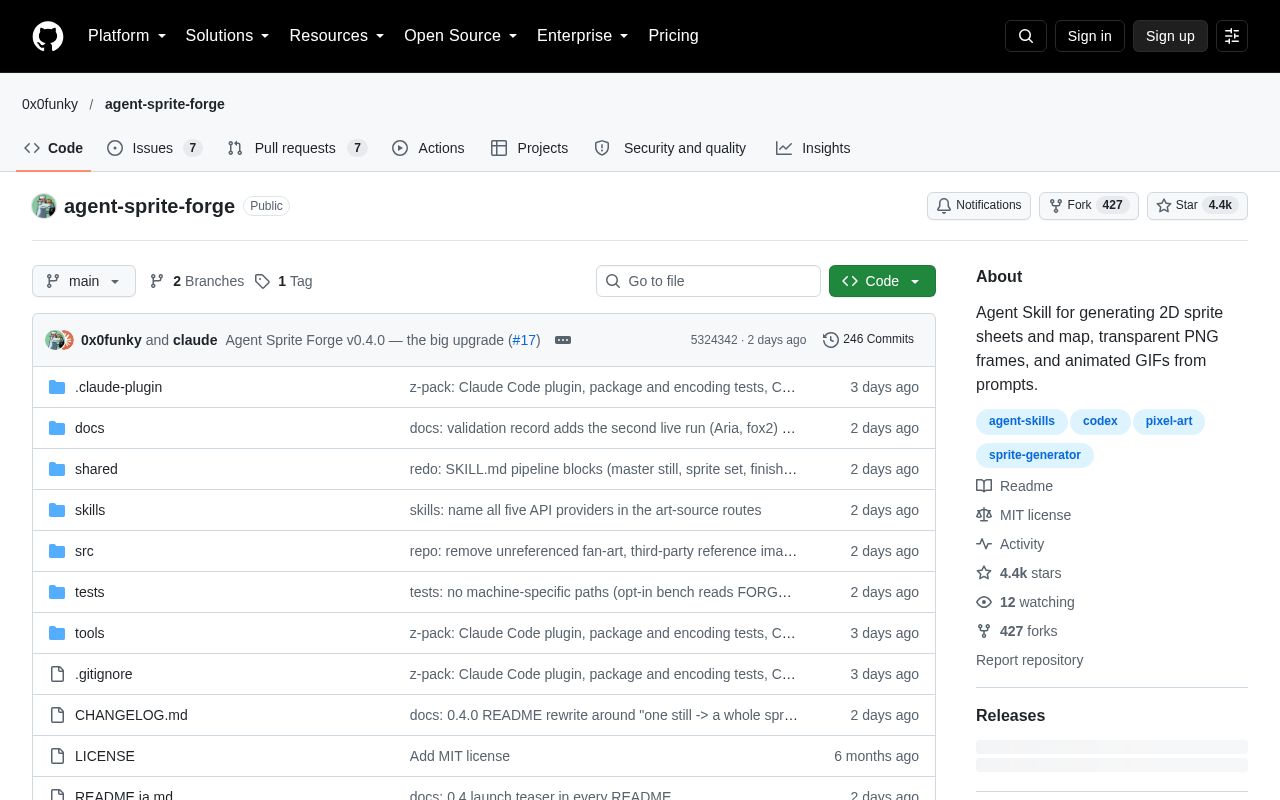
Agent Skill for generating 2D sprite sheets and map, transparent PNG frames, and animated GIFs from prompts.
Hands-free voice conversation with Aadya, a 3D lip-synced indigenous avatar in traditional saree running entirely inside your browser. Aadya bridges centuries of ancestral knowledge, ecological wisdom, and oral folklore with state-of-the-art edge AI.
Every Monday: how many projects were built with AI that week, which tools built them, where they came from, and the week's picks.
Read the latest week