DataLab
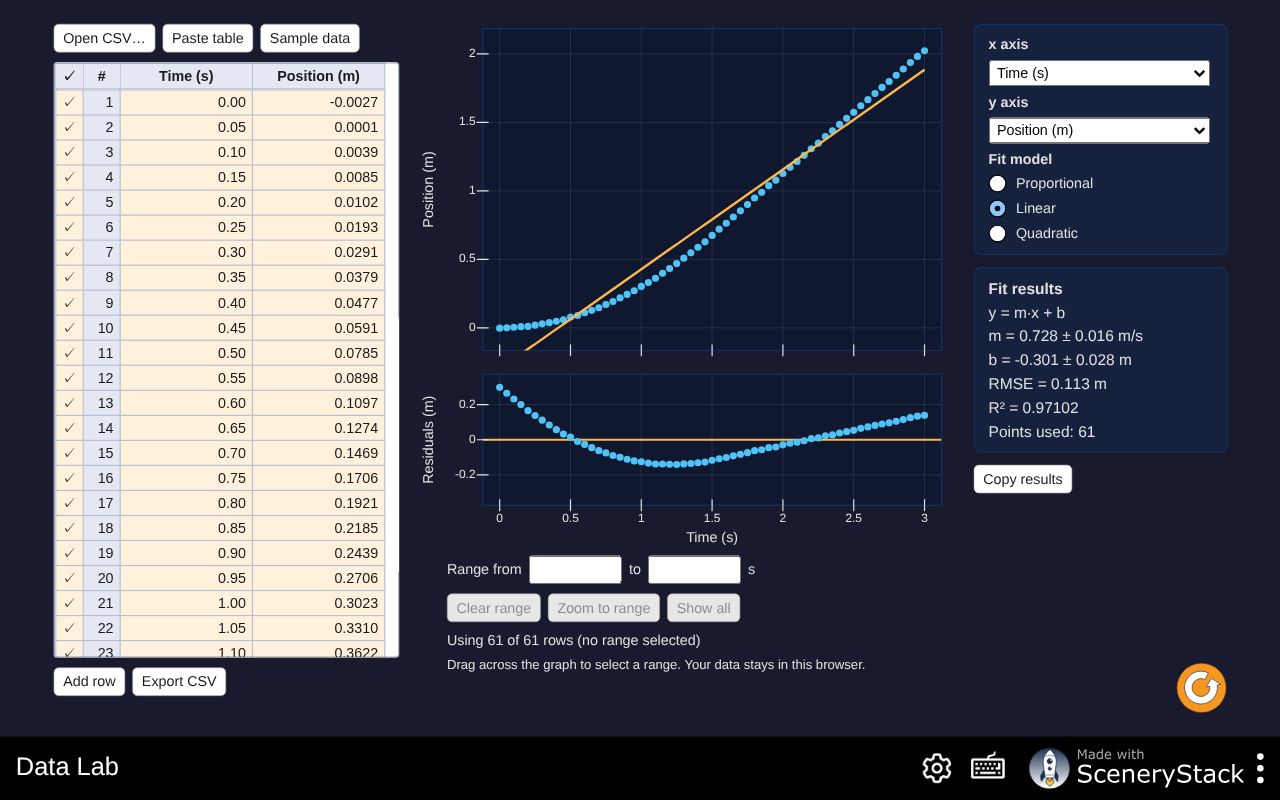
Plot and analyze your own lab data in the browser: import a CSV or paste a table, choose the x and y columns, drag across the graph to select a range, fit a proportional, linear or quadratic model, inspect the residuals, and export the results.